We compare Excel and Google Sheets trading journals against TradeZella, an AI Trading Journal, to help you decide when a spreadsheet is enough and when dedicated software changes your results.
Excel and Google Sheets are free and flexible — but every trade requires manual entry, formulas break silently and corrupt statistics you don't know are wrong, and no formula tells you why your P&L is what it is. At 5 trades per day, that's over 1,300 manual row entries per year and 43–108 hours of data work. TradeZella is an AI Trading Journal that replaces the spreadsheet entirely: trades import automatically, Zella AI detects patterns, and backtesting validates strategies against 11+ years of data — no formulas required.
| Feature | TradeZella | Excel / Google Sheets |
|---|---|---|
| Starting Price | $29/mo (Essential) | Free (Google Sheets) / $6.99/mo (Microsoft 365) |
| Broker Auto-Sync | 500+ (automatic) | None — manual entry or custom scripts |
| AI Features | Zella AI — all plans (trading-specific) | None (formulas and pivot tables only) |
| Trade Replay | Yes (Premium) | No |
| Backtesting | Unlimited (all plans) | Manual formulas only — no historical data engine |
| Free Plan | No | Yes (Google Sheets is fully free) |
| Best For | Automated AI trading journal | Custom analytics and full data control |
Spreadsheet trading journals fail in two ways. The first is time: manually entering every trade — entry price, exit price, size, setup, result — takes 2–5 minutes per trade. At 5 trades per day, that's 1,300 manual row entries per year and up to 108 hours of data work. Most traders miss a few days, face a backlog, and abandon the journal entirely.
The second is silent formula rot. You add a new trade in row 847 and accidentally break the COUNTIF range your win rate depends on. The formula still shows a number — it's just wrong. Excel spreadsheets developed over months build up subtle formula errors that are difficult to detect. You make strategy decisions on corrupted data without knowing it.
TradeZella connects to your broker once and imports every trade the moment your session ends. No entry, no formulas, no maintenance. The journal is always accurate without any manual work.
See how auto-import works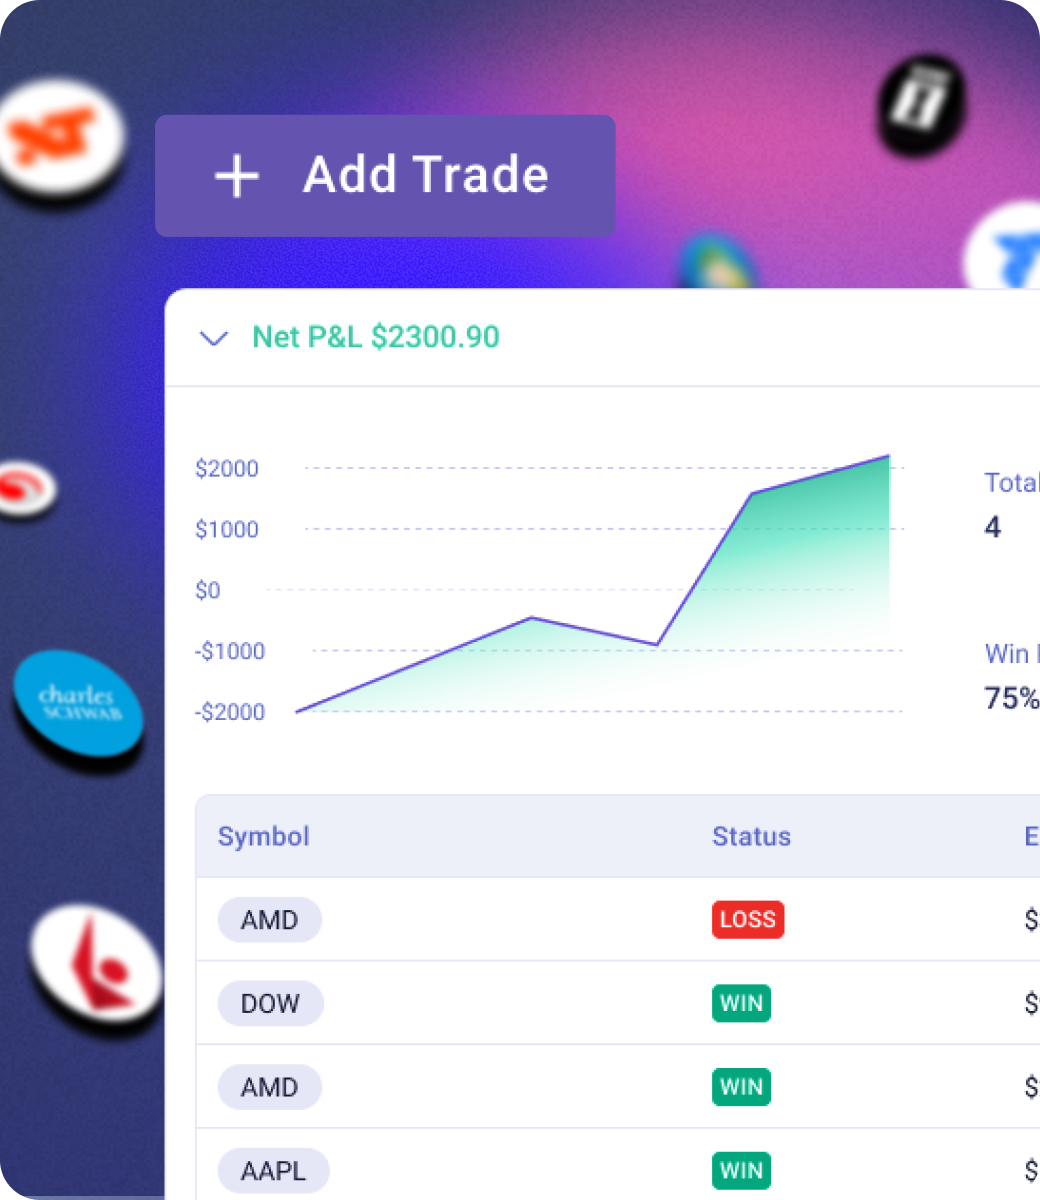
Excel formulas can calculate your win rate, average P&L, and risk-reward ratio. Those are useful statistics. But they tell you what happened — not why, and not what to do about it.
Zella AI reads your actual trade history, your strategy rules, and your journal notes, then surfaces the behavioral patterns and execution errors that your statistics miss. It detects that you trade worse on Fridays, that your average loss is 2x your average win despite a 60% win rate, or that every time you skip your pre-market routine your P&L suffers.
Four automated agents run in the background: Market Sentiment Briefing primes you each morning, Auto-Tagger categorizes every imported trade, Session Review writes your end-of-day recap, and Automated Backtesting validates your strategies — with more on the way. No formula does any of that. Zella AI uses 500–1,000 credits per month depending on your plan, plus a First Import Analysis on signup and weekly and monthly reports automatically.
Explore Zella AI.png)
Excel can hold historical trade data and calculate aggregate statistics, but it has no backtesting engine. If you want to test whether a strategy works, you're manually scanning through historical candles, entering hypothetical trades, and calculating the results by hand — a process that takes hours for what TradeZella does automatically in minutes.
TradeZella's backtesting engine lets you define a strategy in plain English, run it against 11+ years of historical data across all your traded assets, and see win rate, expectancy, maximum drawdown, and where the strategy breaks down. No coding required. No manual data work. Results you can trust before risking real capital.
If you're validating strategies in a spreadsheet, you're spending hours on work that should take minutes. TradeZella's backtesting engine — with 11+ years of historical data and auto-journaling for every backtested trade — replaces manual Excel backtesting entirely. The spreadsheet doesn't stay in the workflow.
See how backtesting works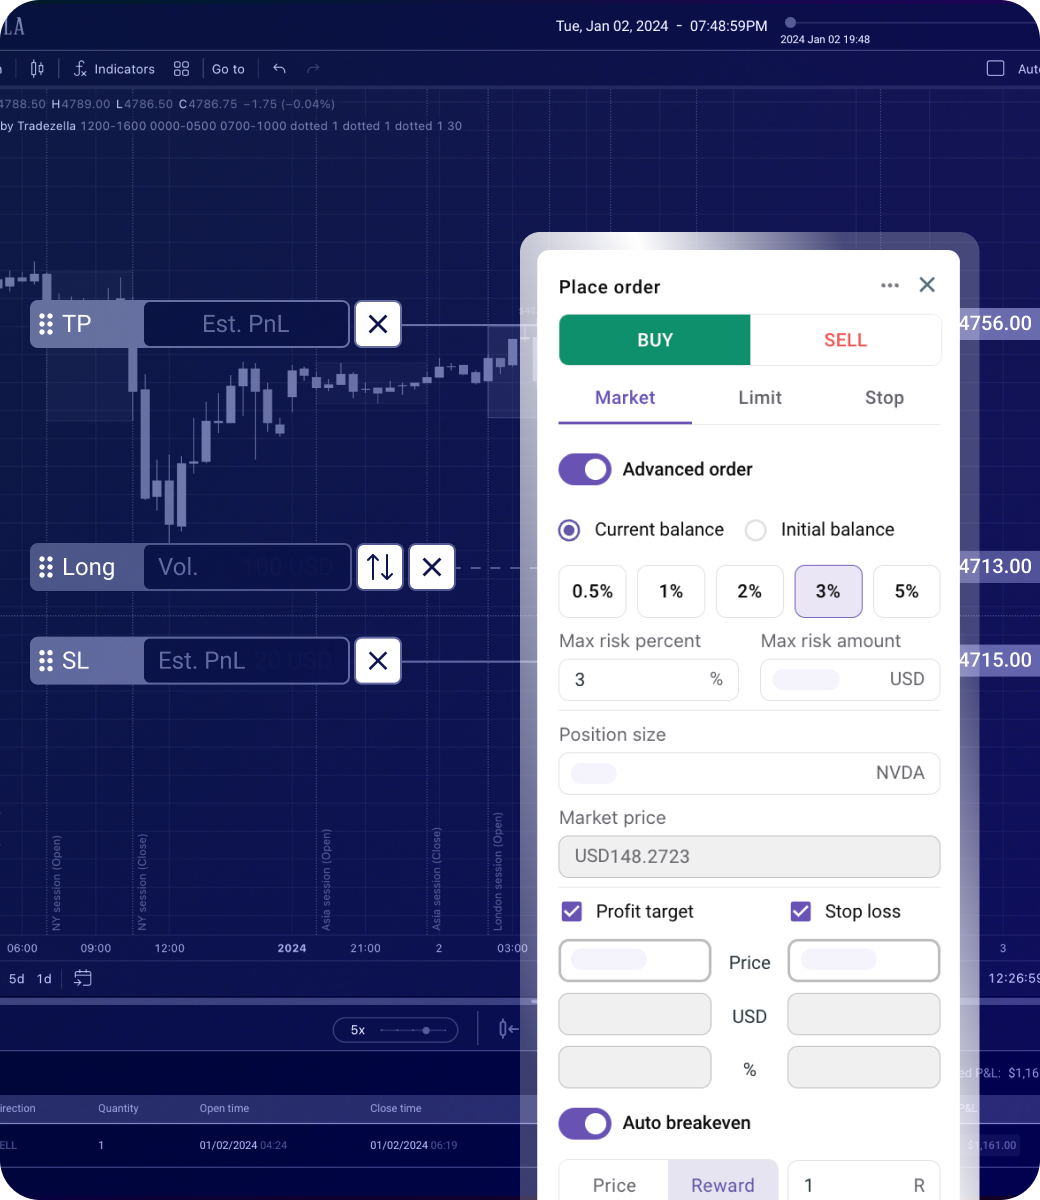
A spreadsheet gives you the numbers you put in. Win rate, P&L by day, average risk-reward — all valuable, but all dependent on you building the formulas correctly and maintaining them as your data grows. And there's one chart most traders never properly set up: a running equity curve. It's the single most useful visual for evaluating strategy health — your account balance plotted trade by trade — and in Excel it requires a separate cumulative column, a manually configured chart, and constant maintenance to keep accurate.
TradeZella generates the equity curve automatically, along with 50+ analytics that would take hours to build in Excel: performance by setup type, time-of-day analysis, drawdown curves, behavioral pattern detection, and P&L heatmaps. None of it requires formulas. None of it breaks.
The hidden cost of Excel is attentional. Every minute spent maintaining the spreadsheet is a minute not spent reviewing what the data actually says. See the full trading journal vs spreadsheet comparison →
Explore TradeZella's analytics
Google Sheets is free. Excel is free on the web or $6.99/month via Microsoft 365. TradeZella starts at $29/month with Zella AI, 500+ broker auto-sync, and unlimited backtesting included. Many traders spend more than $29/month worth of time on spreadsheet maintenance — but if cost is the only barrier, Google Sheets is better than no journal.
AI Trading Journal
Spreadsheet software
Excel / Google Sheets has real advantages worth acknowledging.
Google Sheets costs nothing. If you're just starting out or trade infrequently, zero cost matters — and a basic spreadsheet journal is genuinely better than no journal at all.
A spreadsheet does exactly what you tell it to. If you have highly specific custom analytics, unusual asset classes, or proprietary calculations, a spreadsheet gives you complete control that no fixed platform can match.
Your data lives in a file you control. No subscription, no vendor lock-in, no platform risk. You can structure, export, and manipulate the data any way you want.
As long as your broker can export a CSV, you can import it into a spreadsheet. No integration required — which matters for unusual or international brokers not yet on TradeZella's supported list.
.png)
Zella AI is TradeZella's AI Trading Partner — it reads your trades, rules, and journal, then gives you analysis in plain English from anywhere in the app. Four agents run automatically: Market Sentiment Briefing, Auto-Tagger, Session Review, and Automated Backtesting — with more on the way. Excel has no AI. You are the only one analyzing your data — manually, from formulas that may already be wrong.
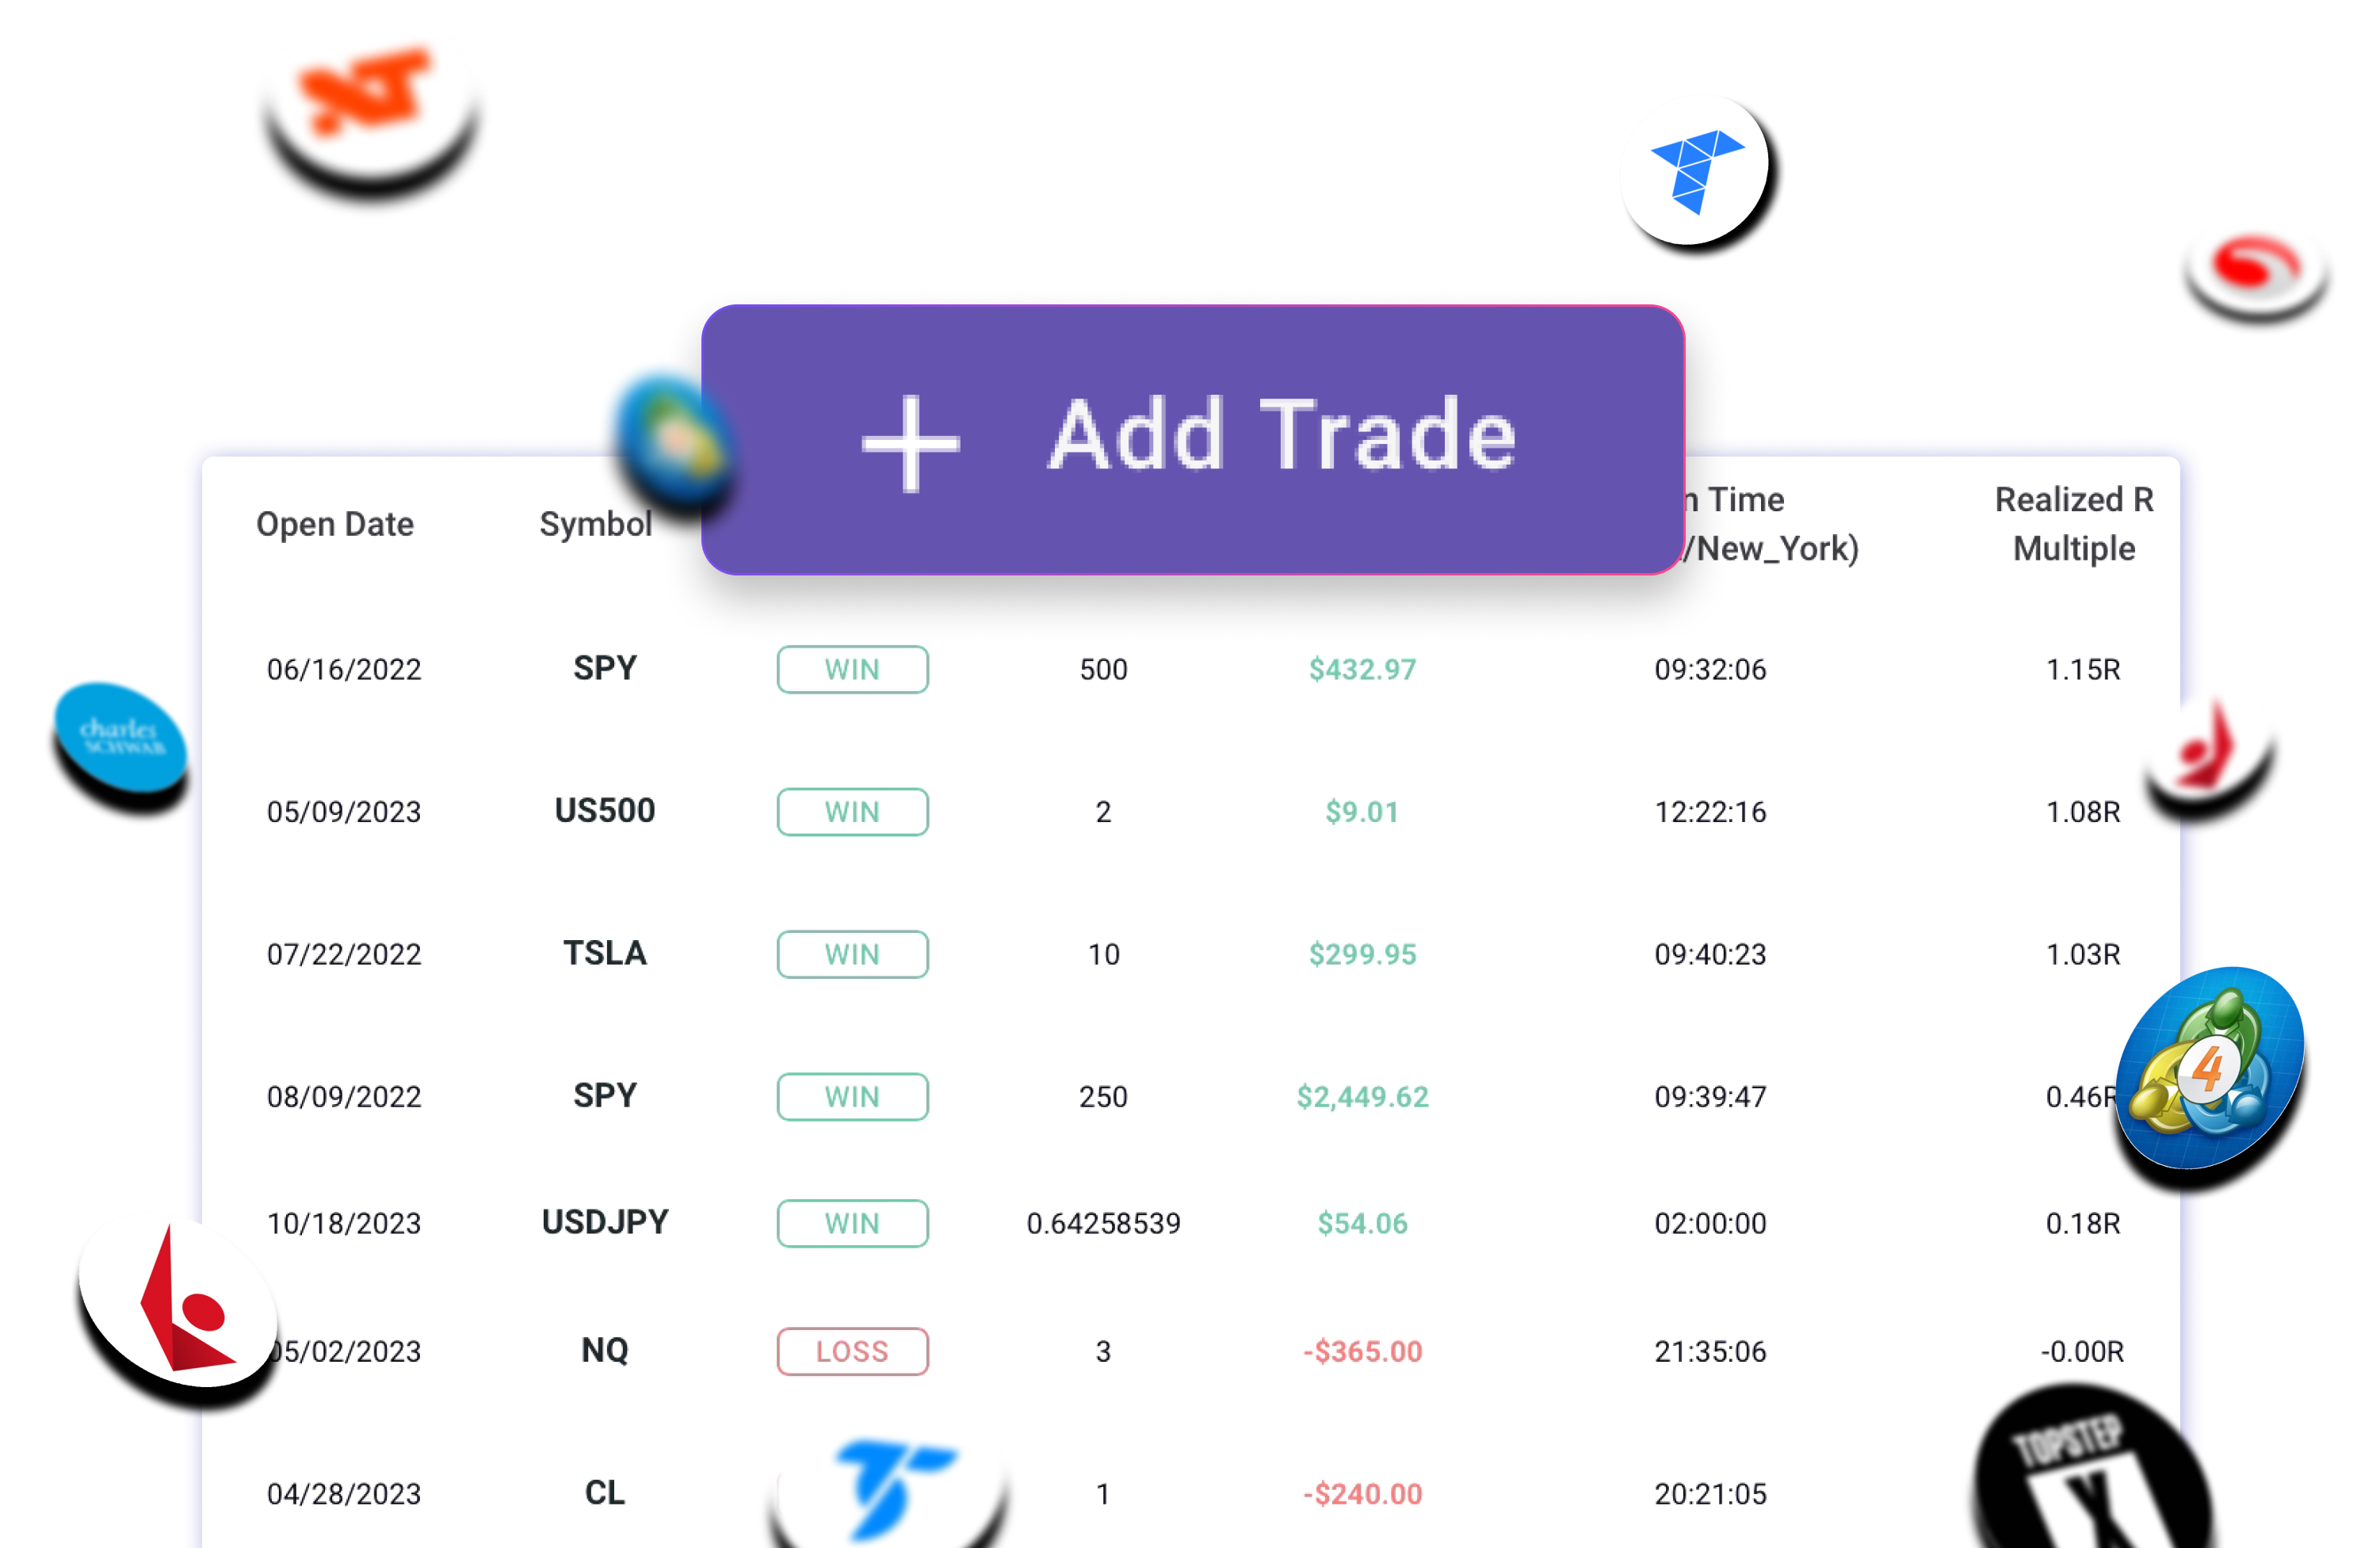
Connect your broker once and every trade imports automatically — no CSV exports, no manual entry, no formulas. Excel and Google Sheets have no broker connections — every trade must be entered by hand. At 5 trades per day, that's 1,300 manual entries per year before you've analyzed a single one. TradeZella supports 500+ brokers including futures, forex, equities, and prop firm platforms.
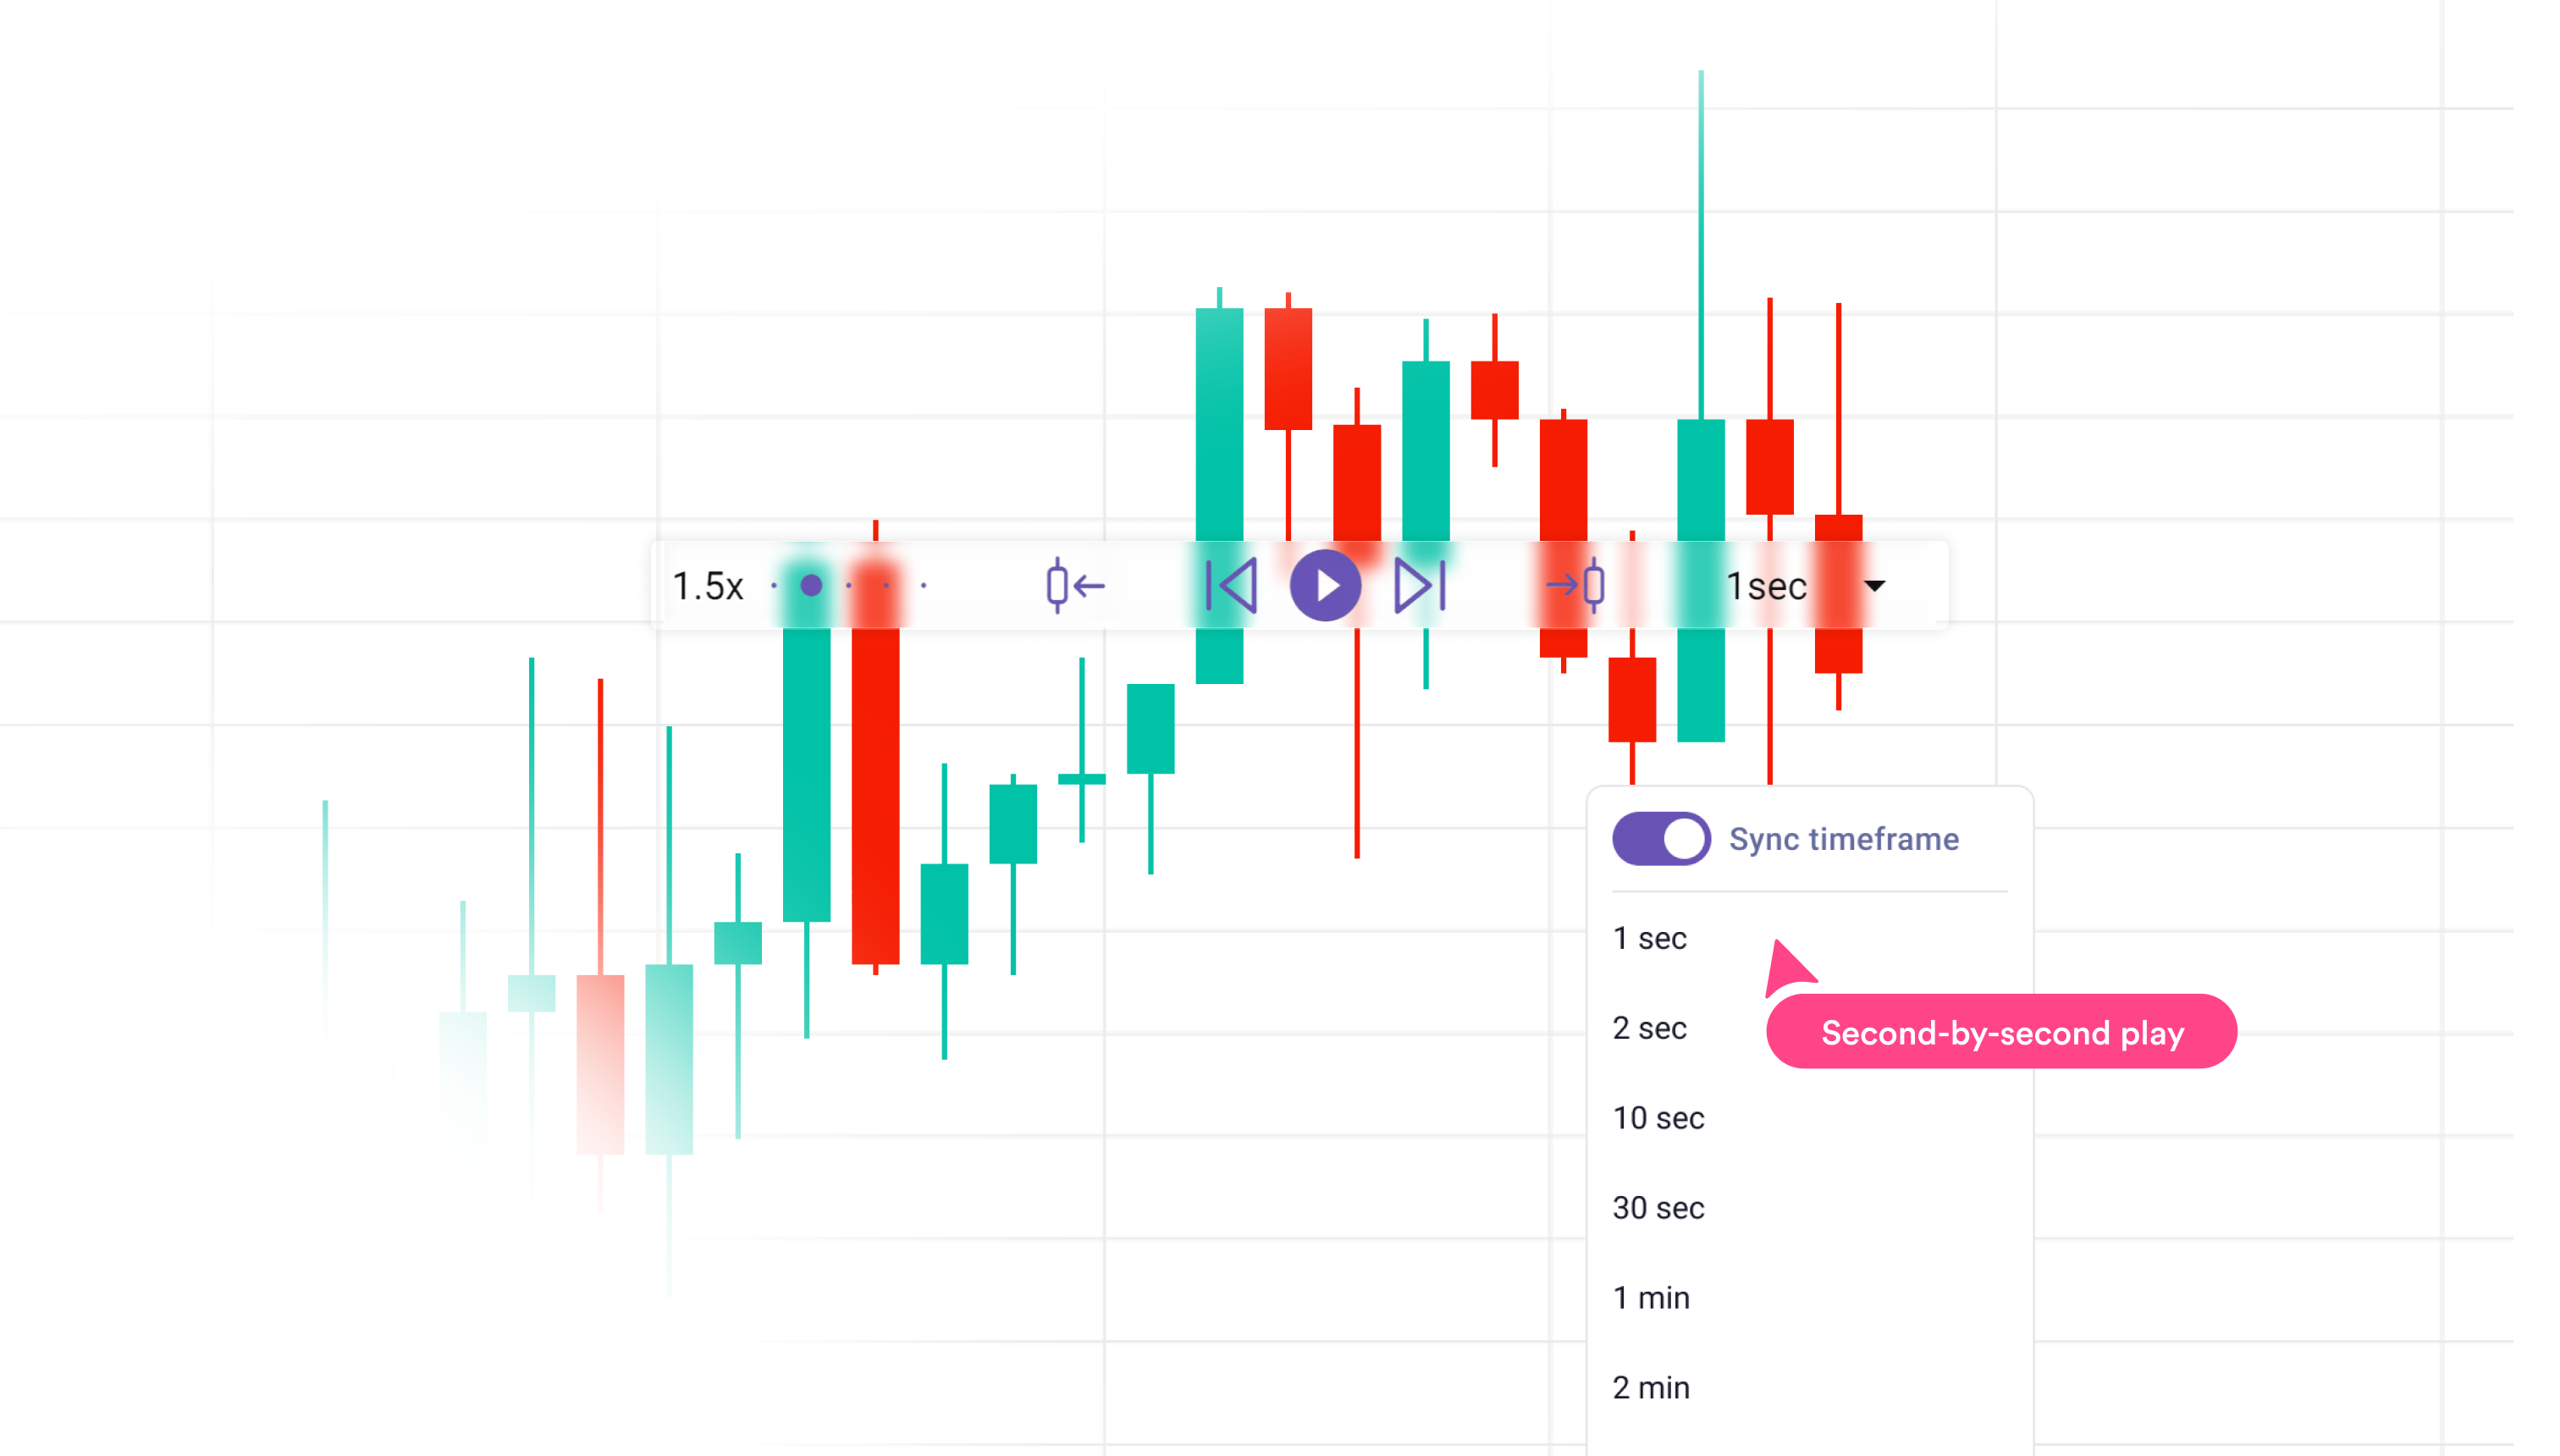
Replay every trade tick-by-tick to see exactly what happened — your entry, your exit, the price action you missed. Excel has no charts built for trading. The only way to visualize a trade is to manually screenshot your broker, crop it, and save it. TradeZella plots entries and exits on real charts automatically. Trade Replay is included on Premium plans.
.png)
Test any strategy against 11+ years of historical data before risking real capital. TradeZella's backtesting engine validates setups, calculates win rate and expectancy, and shows exactly where a strategy breaks down — on all plans.
Spreadsheets are where most traders start — and for fewer than 5 trades per day with basic metrics, they work. But as volume grows, formula rot sets in, maintenance compounds, and the journal becomes more burden than benefit. TradeZella is an AI Trading Journal that replaces the spreadsheet entirely: automatic import, AI analysis, equity curves, and backtesting — none of which require a single formula.
TradeZella removes the friction that causes most traders to abandon their journals — and adds the AI analysis layer that helps them actually improve. If you're already spending significant time on your spreadsheet journal, the switch pays for itself in time alone. Prop firm traders also get Prop Firm Sync — real-time drawdown tracking that a broken Excel formula can't provide. One miscalculation on a trailing drawdown limit can blow an evaluation.
Our recommendation: Start with a spreadsheet if cost is a real constraint. Once you're trading actively enough that manual entry and formula maintenance is taking meaningful time — or once you want pattern detection that goes beyond statistics — TradeZella is the right upgrade.
We set up both workflows with the same set of test trades across futures, equities, and options. For Excel and Google Sheets we measured setup time, manual entry friction, and how long it takes to get from raw trade data to a usable insight. For TradeZella we measured broker connection time and time-to-first-AI-insight.
All prices reflect publicly listed rates as of June 2026. We note which tier unlocks each feature rather than listing base pricing and implying everything is included.
Each platform was graded on six criteria that predict whether a trading journal will actually make you a better trader:
Full transparency: We built TradeZella because we couldn't find a single platform that combined broker auto-sync, always-on AI, and trade replay. That makes us experts on what TradeZella does well — and honest about where it falls short. We've done our best to represent Excel and Google Sheets accurately. If TradeZella isn't the right fit for your trading style, we'd rather you know that upfront.
TradeZella imports trades automatically from 500+ brokers, analyzes every entry with Zella AI, and gives you replay and backtesting tools that no spreadsheet can replicate.
Get Started with TradeZella