

Trading Education
Apr 15, 2025

Support and resistance are two of the most important concepts in trading. It helps traders figure out where prices might stop, reverse, or keep moving in the same direction. Understanding these levels can make a huge difference in knowing when to buy when to sell, and when to wait.
Let's take a look at the basics first.
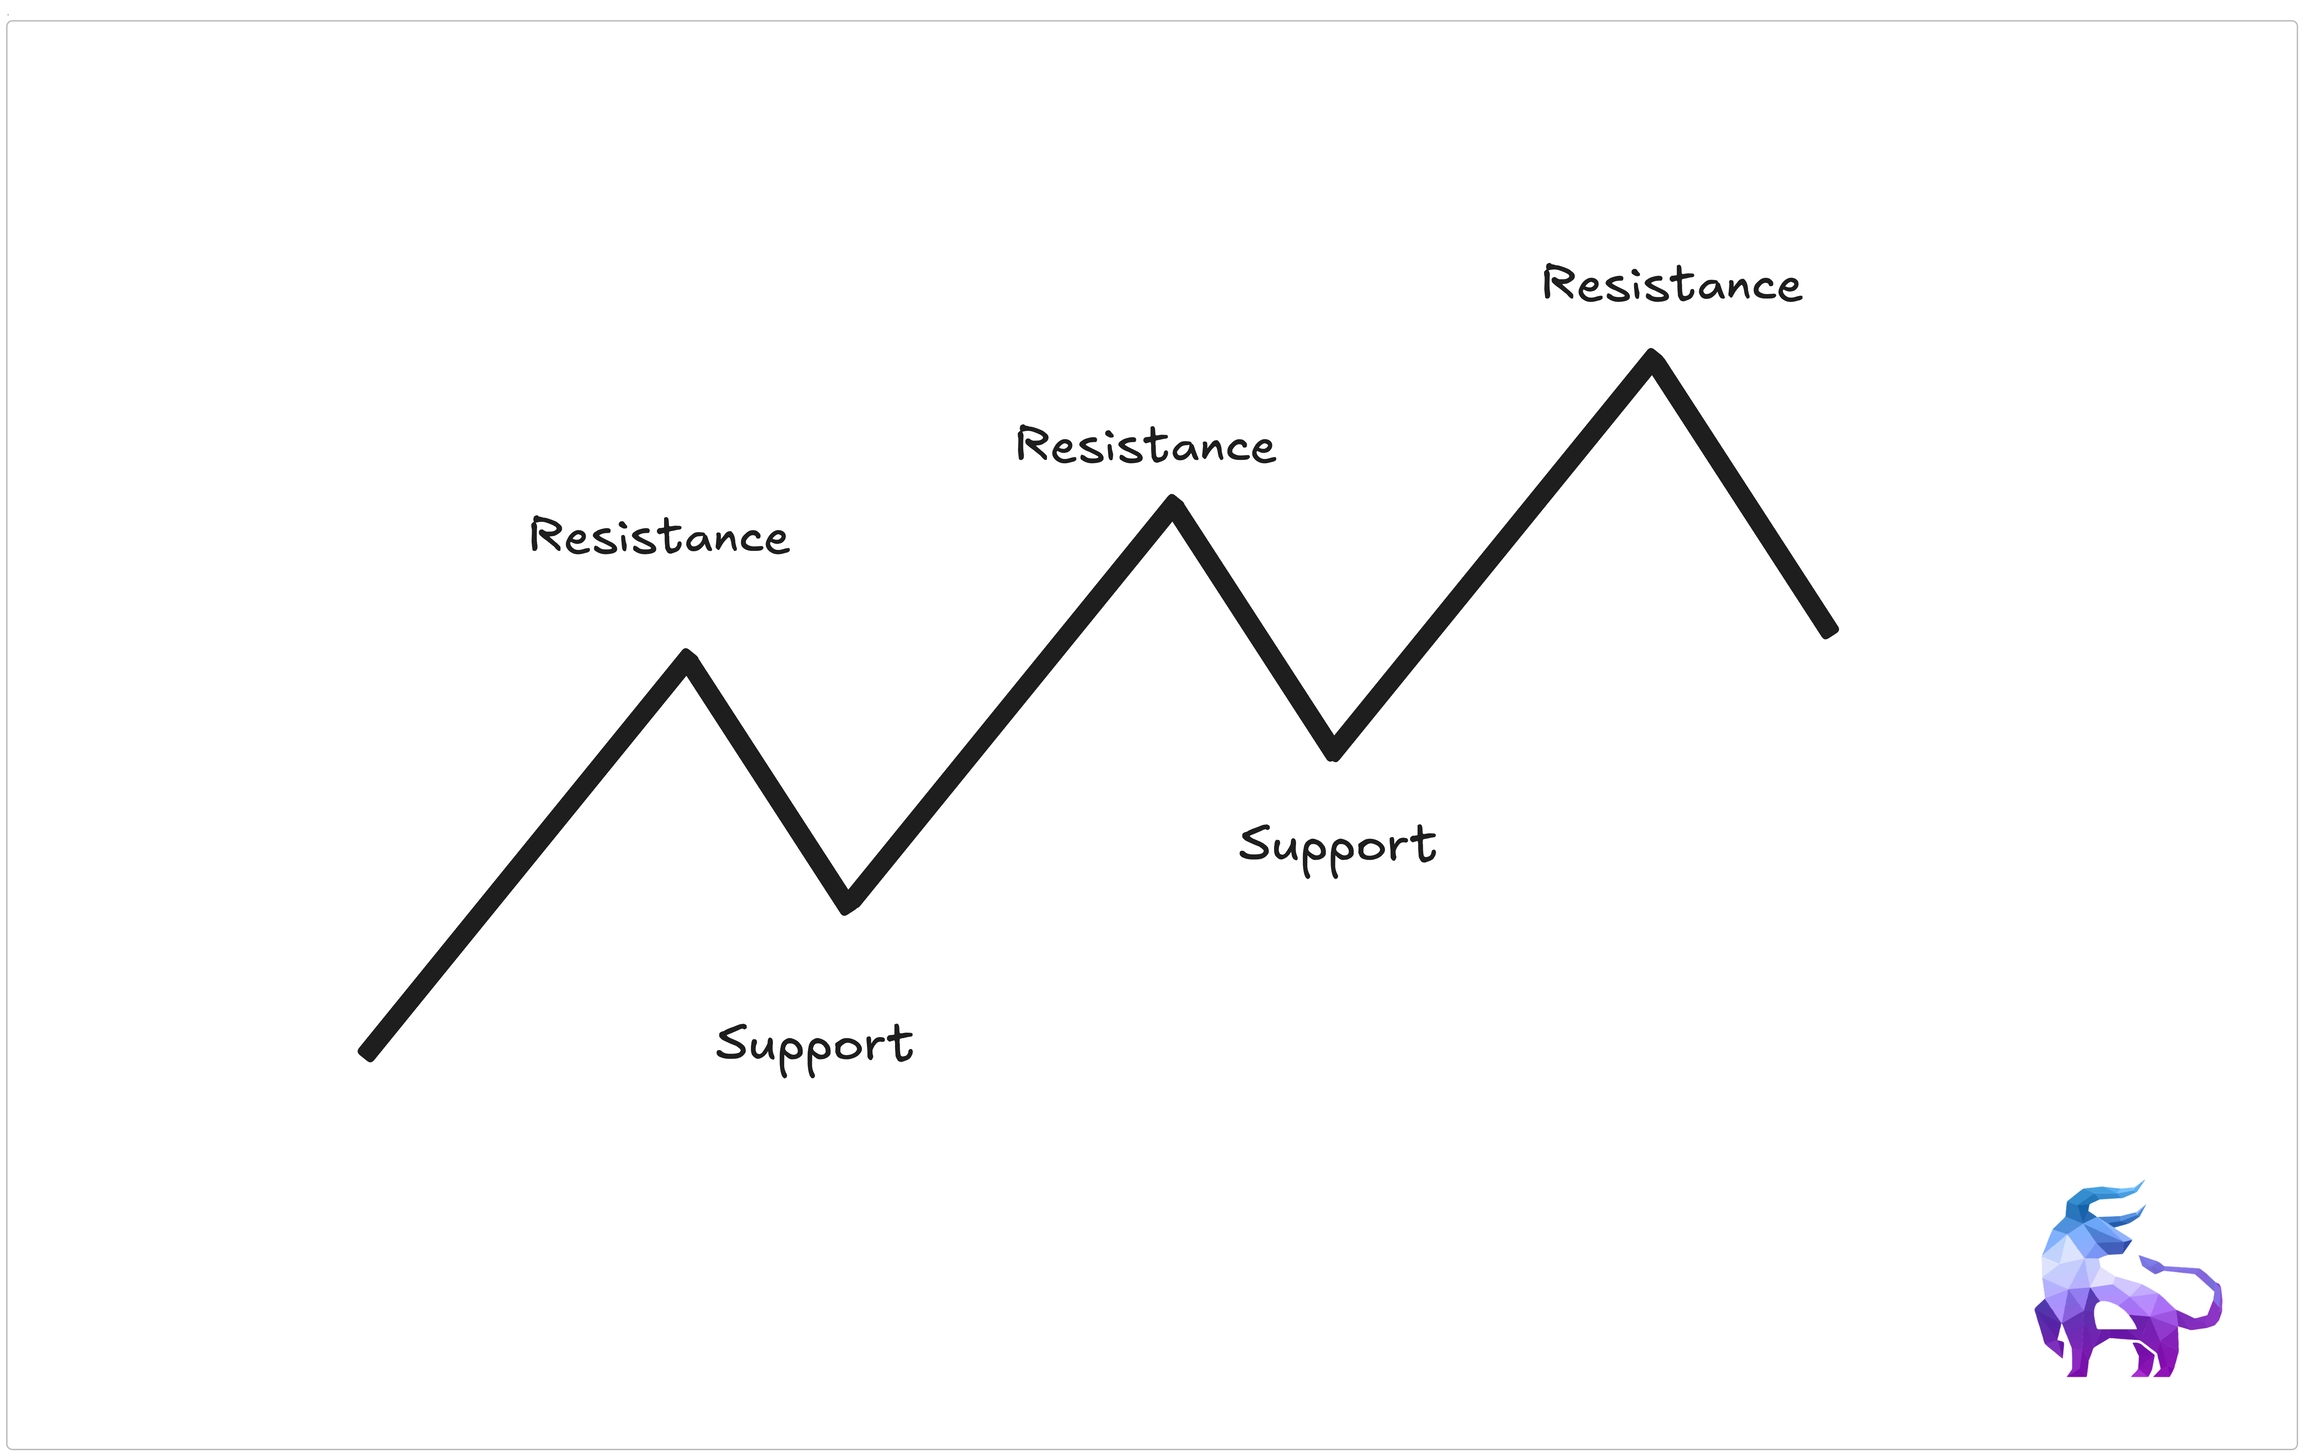
Support is a price level where buying pressure is strong enough to stop the price from falling further. Think of it like a floor that holds up the price. When the price reaches support, buyers step in, pushing the price back up. If a stock or currency pair keeps falling to a certain level and bouncing back up, that level is acting as support.
Resistance is just the opposite. It’s a price level where selling pressure is strong enough to stop the price from going higher. Think of it like a ceiling that price keeps hitting but can’t break through. When the price reaches resistance, sellers start selling, pushing the price back down. If the price keeps going to a certain level and then drops, that level acts as resistance.
But here’s the interesting part — support and resistance aren’t set in stone. When the price breaks through one of these levels, their roles can switch. If the price breaks above resistance, that level can turn into support.
Why? Because traders who were selling at that resistance might now start buying, believing the price would go even higher. The same thing happens with support. If the price drops below support, that level can turn into resistance. Traders who were buying at support might now start selling, thinking the price will keep dropping.

Now let's look at a real example:
This chart of NVIDIA (NVDA) shows how support and resistance levels can switch roles over time.
The first blue line was acting as resistance at the beginning. The price struggled to break above this level multiple times.
Once the price finally broke above this resistance, it later came back down and used the same level as support — meaning buyers stepped in to keep the price from falling further.
That's how resistance and support are interchangeable.

One way is to look at price charts and see where the price has bounced up multiple times — those are likely support levels. Resistance levels are where prices have struggled to move higher before dropping again. The more times the price reacts to a level, the stronger that support or resistance becomes.
What happens when the price reaches support or resistance?
When the price reaches support or resistance, a few things can happen. The price might bounce off the level and move in the opposite direction, which is called rejection. If the price hits support, it could move upward. If it hits resistance, it could move downward.
Here is an example of a price getting rejected from the resistance zone.

But sometimes, the price breaks through these levels.
A breakout above resistance could mean the price will keep going up, while a breakdown below support could signal that the price will continue dropping.
Here is an example of a price getting breaking out of the resistance zone.

Occasionally, the price pushes past support or resistance but then moves right back — this is called a false breakout.
Here is an example of a stock breaking through resistance, but it turned out to be a false breakout.

That’s why, as a trader, it’s important to understand that anything can happen when the price reaches support or resistance. Just because the price touches support doesn’t always mean you should buy, and just because it reaches resistance doesn’t mean you should automatically sell.
Price can bounce or break through these levels, and without considering other factors like volume, trend strength, and market conditions, you could end up on the wrong side of the trade. Instead of blindly reacting, it’s better to wait for confirmation to see how the price behaves at these key levels before making a decision.
Support and resistance levels are important, but knowing how to trade them is even more important. Price doesn’t always react the same way when it reaches these levels. Sometimes it bounces, sometimes it pulls back, and other times it breaks through.
You can use them to decide where to enter and exit trades and even where to place stop-loss and take-profit orders.
When the price reaches a support or resistance level, it often bounces in the opposite direction.
If the price touches support and moves up, it means buyers are stepping in to keep it from falling further.
If the price hits resistance and moves down, it means sellers are pushing it lower.
For example, instead of immediately buying as soon as the price reaches support, it’s better to wait for a bounce to confirm that buyers are actually stepping in. If you’re looking to go short, you want to wait for the price to bounce off resistance before entering a trade.
By waiting for confirmation, you avoid situations where the price moves quickly and breaks through support or resistance instead of bouncing. Trying to buy too early without confirmation is like catching a falling knife — it can lead to painful losses if the price keeps dropping.

Sometimes, instead of bouncing, the price breaks through support or resistance and then comes back to retest the level before continuing in the same direction. This is called a pullback or retest.
If the price breaks above resistance, it may pull back to test that old resistance, which can now act as new support before moving higher.
If the price breaks below support, it may pull back to test that old support, which can now act as new resistance before moving lower.

The break – Price moves past support or resistance
Sometimes, instead of bouncing or pulling back, the price breaks through support or resistance and keeps moving in the same direction. This is called a breakout (when breaking resistance) or a breakdown (when breaking support).
If the price breaks above resistance, it signals that buyers are in control and may push the price even higher.
If the price breaks below support, it means sellers are strong, and the price could continue falling.

Support and resistance are essential concepts in trading, but they are not magic lines where the price always reacts the same way. Instead of blindly buying at support or selling at resistance, you need to consider market conditions, trend strength, and confirmation signals before making a move.
Here are some key things to remember when trading support and resistance:

